Who are your customers? What do they want? and Why should you care?
Most of you reading this will be able to answer these questions with a level of authority... but what if I asked you to prove who your customers are and what they want. How would you do that?
Technology today allows companies to track every digital move a person makes. As the digital marketers in control of this power, it is our responsibility to treat this wealth of information both ethically and with respect.
One of my favourite tools in the ecommerce space that enables this is Google Analytics. It's a reporting tool for websites that allows you to get demographic and behavioural information from everyone that visits your site. I'm using it right now to track what you're reading! Don't be concerned though, around 70% of the top 10k most popular sites on the internet are using it to track what their visitors are doing - so chances are you're being tracked somewhere daily.
(Paranoid Tip: Turn on private browsing on your device if you don't want to be tracked)
My biggest issue with reporting is the difficulty in turning reports into actionable insights. Knowing that 32% of your customers used your search as their first site action is useless on its own. Understanding their search results and creating an action plan to ensure that those customers are getting what they expect on the first attempt is what Analytics is all about. The old "measure twice, cut once" saying is out the window. With Analytics and User Experience (UX) it's all about "measure, cut, measure again".
With a tool as powerful as Analytics there are lot of things to learn, so I thought today we could start at the beginning. Future blog posts will start to cover more advanced topics and offer "takeaway" tips that you can play along with at home. So, let's get started!
How to login to Analytics
Head on over to the Analytics website (https://analytics.google.com/analytics/web/ - Or just google for "analytics") and punch in your login details. If you have a Best Practice Design website with us, then we would have either set up an account for you or set up Analytics on your existing account. Usually this is a marketing@companyxyz.com email address or similar. If you're unsure, please get in touch with us and we can help figure it out for you.
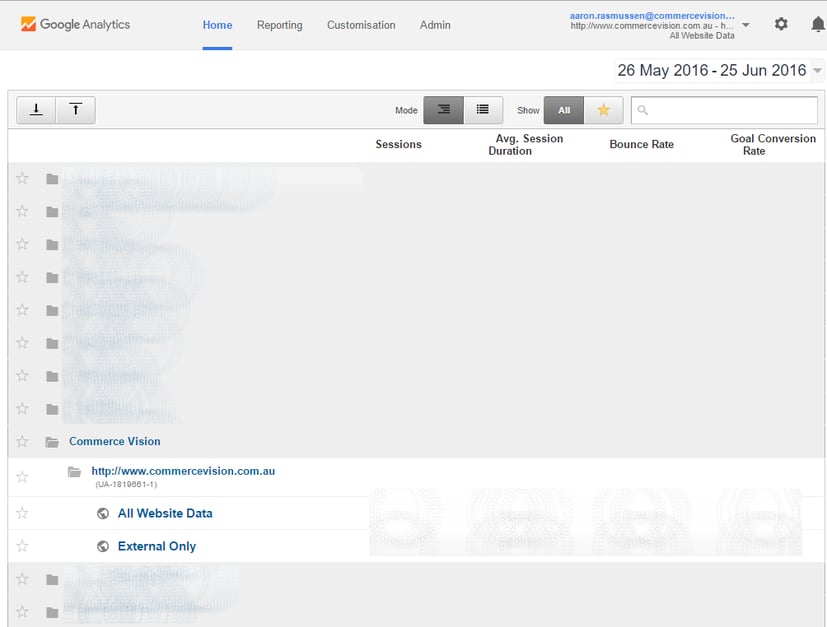
You should see a screen like the one below. You should click on the "All Website Data" (or similar message - it may be your website URL) to start viewing reports.

(Advanced Tip: The "All Website Data" is actually called a View. You can set up a "View" to have different rules for reporting on a single website. I have the Commerce Vision Analytics set up to split All Traffic vs Only External Traffic so our employee visits don't distort the data.)
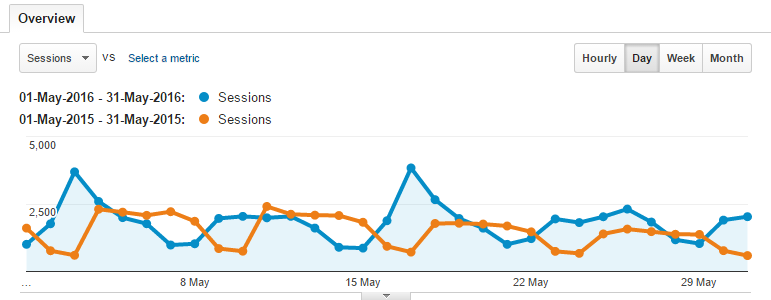
Once logged in, you will see an overview of data using the default settings.

How do I adjust the date for my reporting?
Once you are logged in and looking at Analytics, the first thing you will want to do is confirm the time period you want to report on. Up the top right you will see the currently selected dates, which default to the previous 30 days, not including today. You can click the drop-down to bring up a calendar view with some options.

Click the date you wish to be the "start" date of your report then click another date to define the "end".

You also have the ability to compare you data to previous periods. One of my favourites is comparing Year on Year but you can put any dates you wish.

Why doesn't it show today in the default dates?
Analytics can be a little slow in showing the latest information. The standard (free) version doesn't promise "fresh" data so anything close to the current date could be inaccurate. It's best to take the previous 24hrs of data with a grain of salt, outside of the Real Time reporting tool.
Real Time reporting? Tell me more...
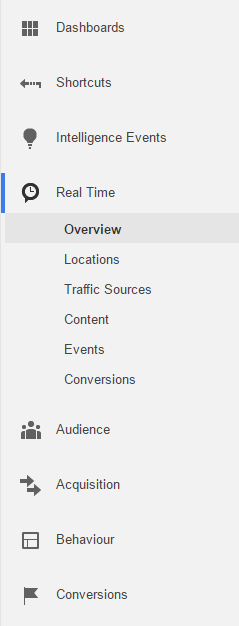
If you look at the left hand side menu of Analytics you'll see a Real Time menu option.

The pages within this section will give you up-to-the-second information about the visitors on your website. It's a cute little display showing the split between mobile/desktop/tablet, where people came from and where they currently are.... but it doesn't give you much insight that you can turn into something actionable. There are cases where it's useful (during a large promotion like ClickFrenzy it's good to keep an eye on what the bulk of people are doing) but it's not something I use frequently.
Where are my customers coming from?
The "Acquisition" menu shows information about how people ended up on your website, which could be via:
- Organic Search - Google, Bing, etc
- Direct - people typing in www.company.com or using their bookmarks
- Social - Facebook, LinkedIn etc
- Paid Search - AdWords, the ads you see when you search on Google
- Email - via an email you may have sent them, marketing or otherwise
- Referral - They clicked on your website from another website
- Display - like AdWords, but shown on other websites
- Other - Everything else

With each of these sources you can generally get more information about the keyword(s) they searched in Google or the ad they clicked, but I'll cover that in a future post.
How much revenue has the site generated?
If you click on the ecommerce menu you should start to see data like this:

There are various reports/pages in this section that help you understand what the numbers are. With the introduction of Enhanced ecommerce as a standard feature in BPD in July I plan to host a webinar to go into detail on how to navigate this section.
Financial reporting is a funny thing. The reality is that your real financial reporting should come from your PRONTO ERP, but the ecommerce Revenue reporting in Analytics is very useful for understanding what behaviour resulted in a customer converting. It's particularly useful in understanding the source (i.e. Organic Search vs Email) that is generating your revenue. This is a great way to quantify the effort the marketing team spend on producing your promotional eDM's (Electronic Direct Marketing - i.e. promotion emails) but just remember... revenue isn't everything!
It's important to not get too married to the fact that the numbers are reporting that Email (or some other source) generated $x for the month. Sometimes an early influence via Email actually caused the sale two weeks later. The last link a customer clicked to get to your site will get the credit for the sale in Analytics... but the influence for that sale may have taken awhile and come from various places. There is a way to look at the lifetime of a transaction and Analytics handles this using something called "attribution modelling", which I will be sharing more information on in a future blog post.
Where are my customers?
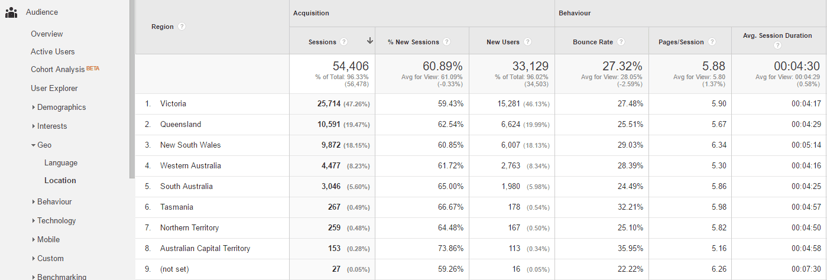
For the B2B world you would already have a lot of information about the debtors on your books, but Joe Public could live anywhere. Analytics allows you to zoom in on states and cities with a good level of accuracy. The Audience menu within Analytics stores basic information about your customers such as their location, basic behaviour and the technology they are using (mobile vs tablet vs desktop!) and is a good place to go and learn more about who your customer is.

Today was an intro into Google Analytics to get you comfortable with the basic use of the tool. Over the coming months I will start to dive deeper into retrieving actionable insights from it, allowing you to better service your customers. If you have any requests for topics you would like to learn about, be sure to drop us a line in the comments below!
When asked who my customer is or what they want, I never assume to know the answer - I let the data tell the story.
